Remaking of Off the Staff
By Nicholas Rougeux, posted on June 20, 2017 in
I still can’t read music but I can parse it a lot more efficiently now. Thanks to the help of the good folks at MuseScore, creating new editions of Off the Staff is now much more streamlined. Since my first attempts at visualizing music, I learned of new methods for making the images and even how to animate them.
Motivation
I’ve wanted to create more images for Off the Staff since I created the originals in September 2016 but the process had bottlenecks that zapped my motivation. However, several months ago, I was approached by the MuseScore team to partner with them on OpenScore—a Kickstarter campaign to liberate public domain sheet music by making it available in open formats on any device. They wanted to use the images I generated as cover images for each score. That was an exciting prospect and I happily agreed. In order to do this efficiently, we wanted to streamline the process for creating the images, which meant finding a way to eliminate the annoying bottlenecks
New method
My original method involved several unnecessary steps mostly because I was avoiding writing code to do the parsing. I preferred to use existing tools to convert data, even if doing so required extra steps.
The original process was:
- Export XML from MuseScore
- Convert XML to CSV with Luxon: The web-based tool had a 4mb size limit and several scores had so many notes that resulted in XML files beyond that limit which meant I had to use the downloadable tool and it only worked in Windows. Being a Mac user, this meant I had to use a Windows virtual machine each time to convert XML to CSV files. Plus, I was using a computer that was seven years old, which meant just turning it on took a while. Booting up Windows was very slow process.
- Upload select CSV files to Google Sheets: Copying and pasting tens of thousands of cells into Google Sheets was a slow process and prone to failing—even with the speediest of browsers.
- Combine CSV files with Google Sheets: The process of combining CSV files with Google Sheets was the most time-consuming step of the original process and had the risk for inaccuracy. I used Google Sheets because it was easier to get the lookup formulas working to combine the three CSV files for each score (notes, measures, and parts) into one final file.
- Import CSV into NodeBox to generate images
Peter Jonas from MuseScore was kind enough to write a script to eliminates Google Sheets entirely and the risk of inaccuracy. The script—midicsv-process—not only parses data from a MIDI file but accounts for tempo changes so each note has an accurate timestamp.
The new process is:
- Export MIDI from MuseScore
- Generate CSV from MIDI file with midicsv-process
- Import CSV into NodeBox to generate images
The result is a much cleaner set of data, complete with note names like D4# (a D# in the fourth octave) for verification. I can’t thank Peter enough for writing this script. Thanks, Peter!
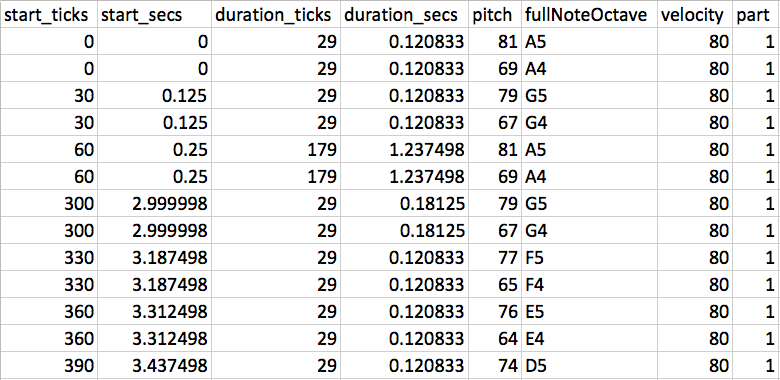
First few notes of Toccata and Fugue data
Prior to this script, I wasn’t able to plot notes based on when they were played because timestamps weren’t included in the XML export. The closest to a timestamp was a value that indicated how far each note was placed in each measure of the sheet music. That meant I could tell when notes were played simultaneously but tempo changes weren’t factored in and I had to cobble together some concatenation formulas to generate timestamp-like values based on several values for each note.
Once I had those timestamp-like values, I chose to space them out equidistant around a circle. While this produced nice graphics, they weren’t as accurate as I wish they were. Below is an example of the difference this makes for Vivaldi’s Four Seasons.
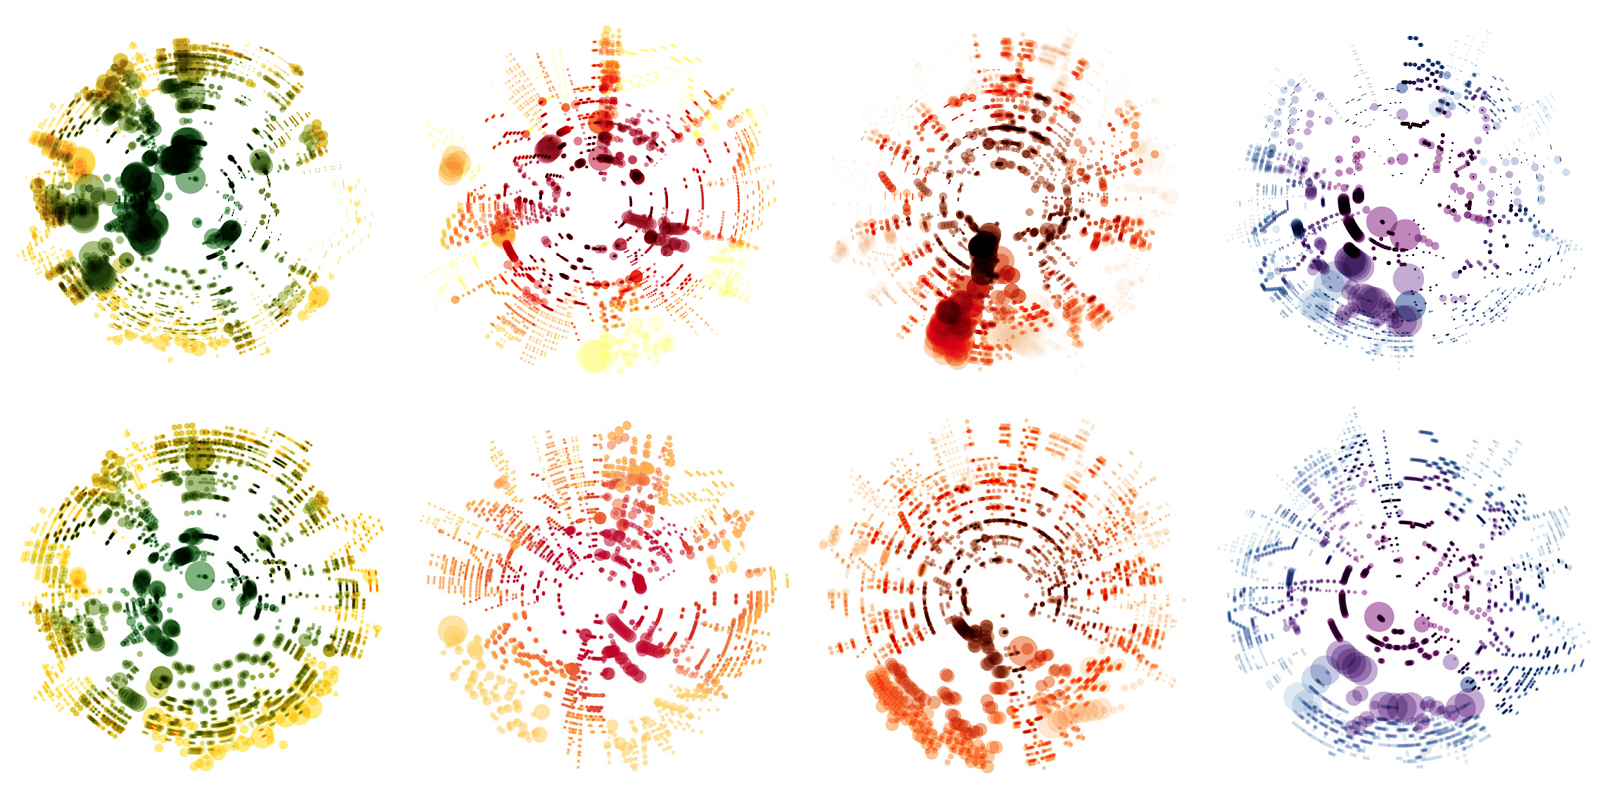
Vivaldi’s Four Seasons generated using the original method (top row) and the new method (bottom row) for Spring (first from left), Summer (second), Autumn (third), and Winter (fourth).
In the image above, the difference is like night and day (to me at least). The top row of images is very chaotic and possibly had calculation errors. The bottom row of images is much more structured and consistent. Patterns of the music are more apparent and overall, they’re more visually appealing.
Animations
Ever since I created the first images, I wanted to see them in motion—partly because I thought they would be fun to watch, partly for debugging them to make sure they’re accurate, but also so others could understand them better.
Having timestamps for each note made animations a reality. With some extra work (and more than a few headaches), I was able to bring the illustrations to life and to show how the images were made. Combining timestamps with durations of notes event allowed me to make each circle/note grow for as long as it’s played.
MuseScore generates MP3 files for each score uploaded to their community so once an animation is generated, I was able to sync it with the audio to produce the final animations.
The animations really bring these images to life and I enjoy watching each one. All are available in my Off the Staff YouTube playlist.
NodeBox
All of these animations were created in NodeBox and combined with the audio in Premiere. NodeBox has a great feature to use animation frame numbers as values. Videos are exported at 30 frames per second (fps). Knowing this, I was able to feed in the note data and determine which notes should be visible and even how much of it was played at any given frame. Then, it was just a matter of rendering all the frames. I wanted the animations to be high quality so they’re all rendered at 30 fps at 4K resolution, which means each one does take several hours and sometimes days to render.
Below is an annotated diagram of my NodeBox setup.
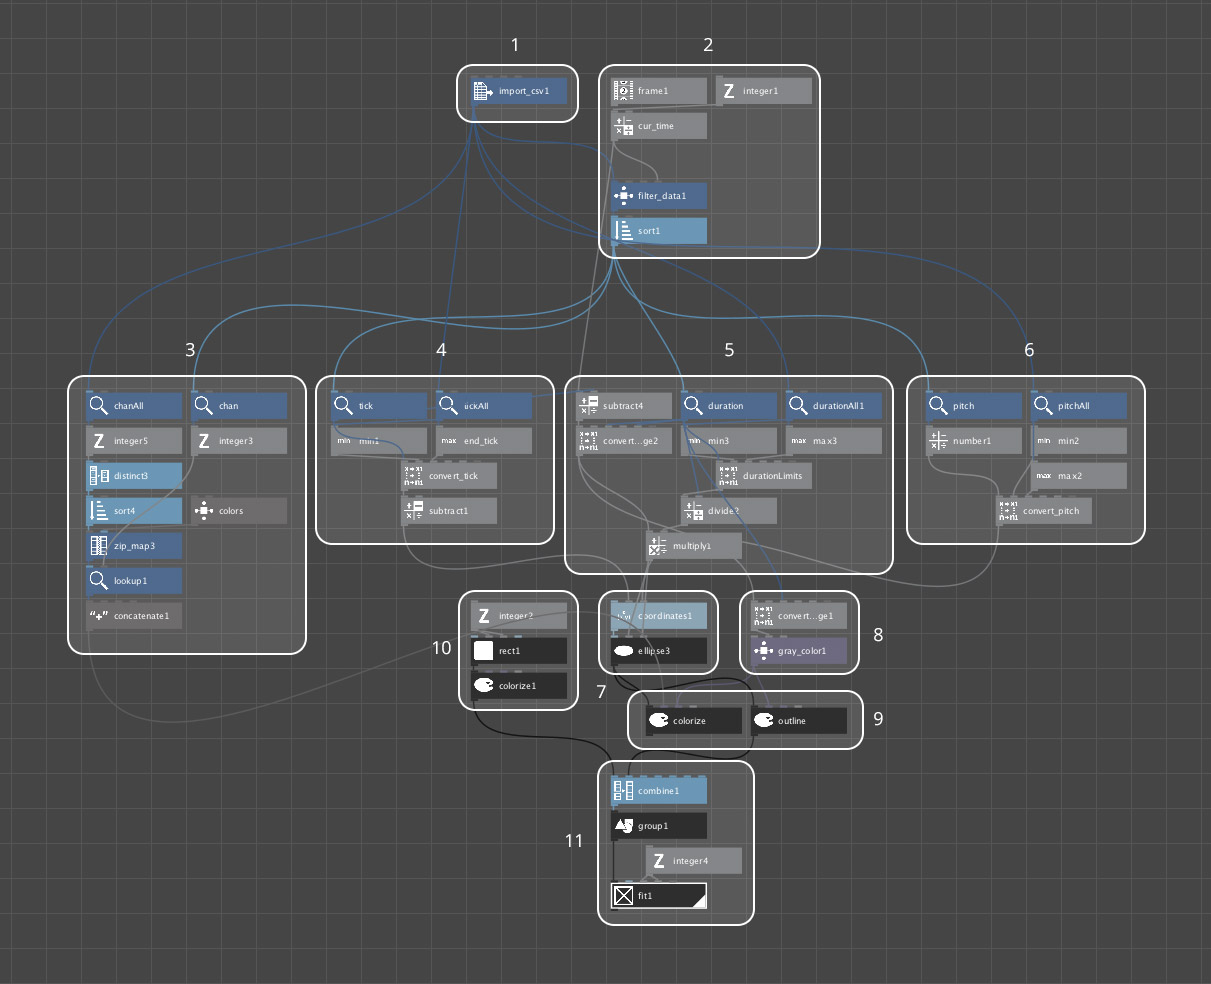
- Import the CSV generated from midicsv-process.
- Use the frame number to calculate the current time, which is used determine what notes to show—the equivalent of saying, “At X seconds in, show all notes played up until X.” Frames are divided by 30 because NodeBox renders videos at 30 fps and the CSV data is measured in seconds.
- Calculate color based on instrument (only for scores with multiple instruments).
- Calculate angle at which a note should be placed, starting at 12 o’clock.
- Calculate circle size based on duration. (Looks simple but figuring this out and how far a circle grows based on its duration was probably the hardest part of this entire project!)
- Calculate distance from center based on pitch and octave.
- Position each circle/note based on angle and distance from center.
- Calculate the opacity of the black outline of each circle as it grows for colorful scores. The outline makes the notes more visible while they’re being played and fades away after they’re played.
- Options for showing colors or just outlines for an image.
- A simple white square a background for the final image.
- Combining all the circles/notes and white square into one image and scaling it for high resolution.
Future plans
I will be working with MuseScore to create many more images for OpenScore if the Kickstarter succeeds. Even if it doesn’t (but I hope it does), I will continue creating images and animations for many scores. I can’t wait to see what kinds of images come out of them.